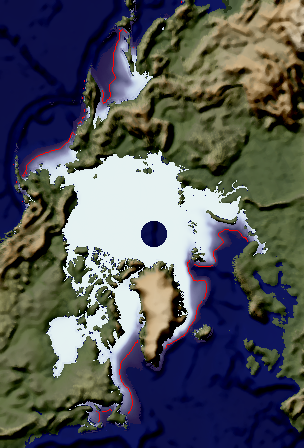
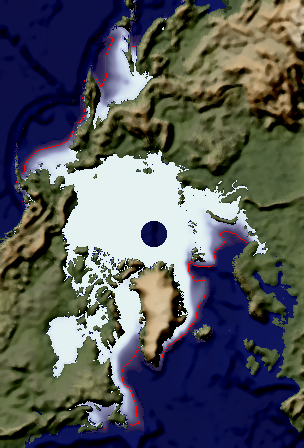
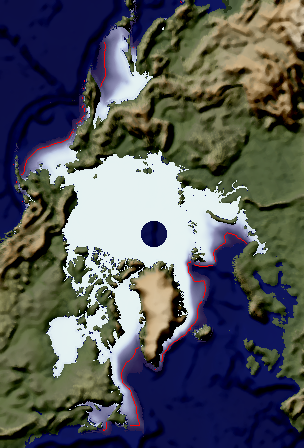
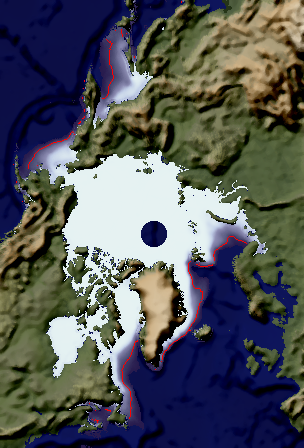
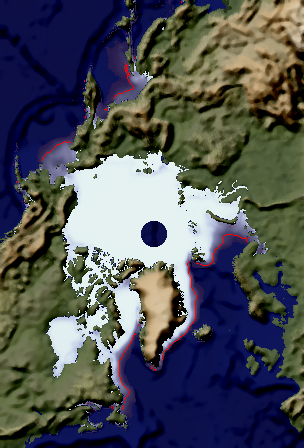
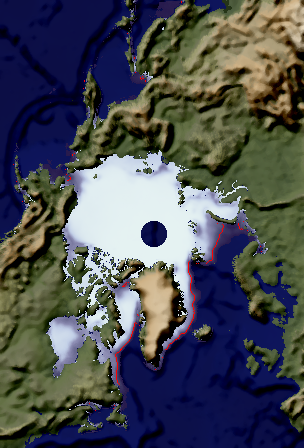
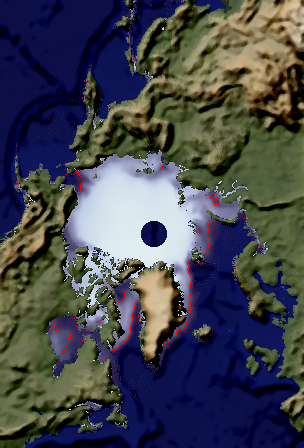
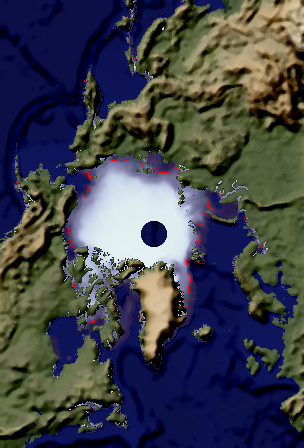
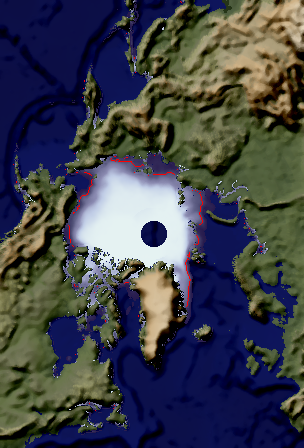
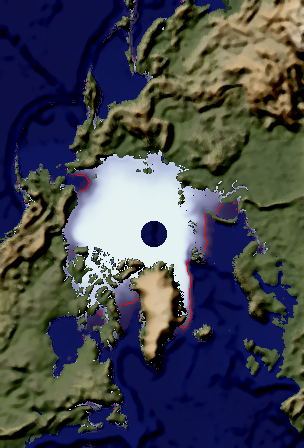
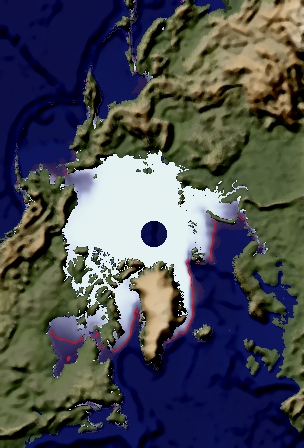
Sea Ice Concentration - Average of 1979 - 2007, Copyright of figures: NERSC/NIERSC
Note: Red line is 15% sea ice concentration contour.
Click on each image to get more information!
| January | February | March | April |
 |
 |
 |
 |
| May | June | July | August |
 |
 |
 |
 |
| September | October | November | December |
 |
 |
 |
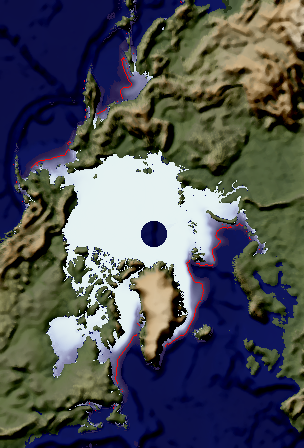 |
Note: the value of 15% ice concentration is showed by red line in the figures.
Animation: the average monthly mean sea ice concentration of 1979 - 2007
Animation: All monthly mean sea ice concentration from 1978.11 to 2006.9
Data Attribution: The data provided on this website is sourced from the Nansen Environmental and Remote Sensing Center (NERSC) Arctic Sea Ice Observing System (https://iceobs.nersc.no), using the NERSC developed NORSEX Sea Ice algorithm. It uses DMSP SMM/I Brightness temperatures (https://nsidc.org/). It is updated daily and intended for informational purposes only. If you use or reference this data, please attribute it to "NERSC Arctic Sea Ice Observing System" and include a link back to this website (https://iceobs.nersc.no). NERSC makes no warranties regarding the accuracy or completeness of the data.